Note
Go to the end to download the full example code.
Time series and order parameter#
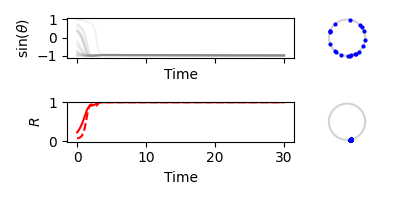
plot_sync() combines the oscillator time series,
the order parameters R1 and R2, and phase snapshots at t=0 and t=T.
import matplotlib.pyplot as plt
import numpy as np
import xgi

import hypersynchronization as hs

N = 20
rng = np.random.default_rng(42)

H = xgi.complete_hypergraph(N, max_order=2)
links = H.edges.filterby("order", 1).members()
triangles = H.edges.filterby("order", 2).members()

thetas, times = hs.simulate_kuramoto(
    H,
    omega=rng.normal(0, 0.1, N),
    theta_0=hs.generate_state(N, kind="random", seed=42),
    t_end=30,
    dt=0.1,
    rhs=hs.rhs_23_sym,
    integrator="RK45",
    args=(2.0, 1.0, links, triangles),
)

fig, axs = hs.plot_sync(thetas, times)
plt.tight_layout()
plt.show()
Total running time of the script: (0 minutes 0.632 seconds)