Note
Go to the end to download the full example code.
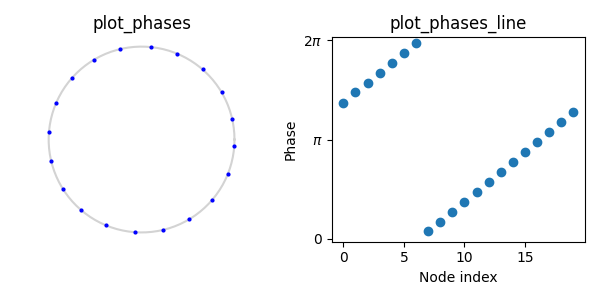
Phase distribution plots#
plot_phases() shows the phase distribution on
a unit circle. plot_phases_line() shows phase
values ordered by node index, making the state structure easier to read.
import matplotlib.pyplot as plt

import hypersynchronization as hs

N = 20
theta = hs.generate_q_twisted_state(N, q=1, noise=1e-2, seed=0)

fig, axes = plt.subplots(1, 2, figsize=(6, 3))

hs.plot_phases(theta, ax=axes[0])
axes[0].set_title("plot_phases")

hs.plot_phases_line(theta, ax=axes[1])
axes[1].set_title("plot_phases_line")

plt.tight_layout()
plt.show()
Total running time of the script: (0 minutes 0.078 seconds)