Note
Go to the end to download the full example code.
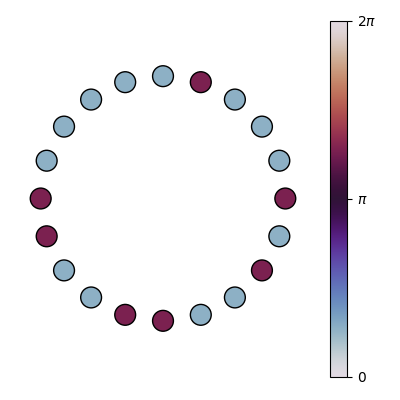
Phases on a ring#
plot_phases_ring() places oscillators on a
circle and colours each node by its phase value.
import matplotlib.pyplot as plt
import xgi

import hypersynchronization as hs

N = 20
H = xgi.complete_hypergraph(N, max_order=2)

theta = hs.generate_k_clusters(N, k=2, ps=[0.5, 0.5], noise=0, seed=0)

fig, ax = plt.subplots(figsize=(4, 4))
hs.plot_phases_ring(H, theta, ax=ax, node_size=15)
plt.tight_layout()
plt.show()
Total running time of the script: (0 minutes 0.049 seconds)