Note
Go to the end to download the full example code.
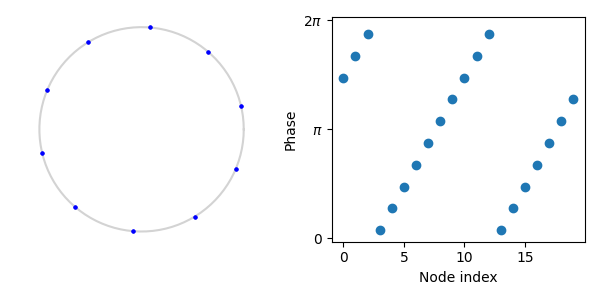
Two-twisted state#
In a q-twisted state the phases wind q times around the circle with node index. For q=2 the phase-vs-index plot shows two full cycles, distinguishing it from the splay state (q=1).
Total running time of the script: (0 minutes 0.061 seconds)